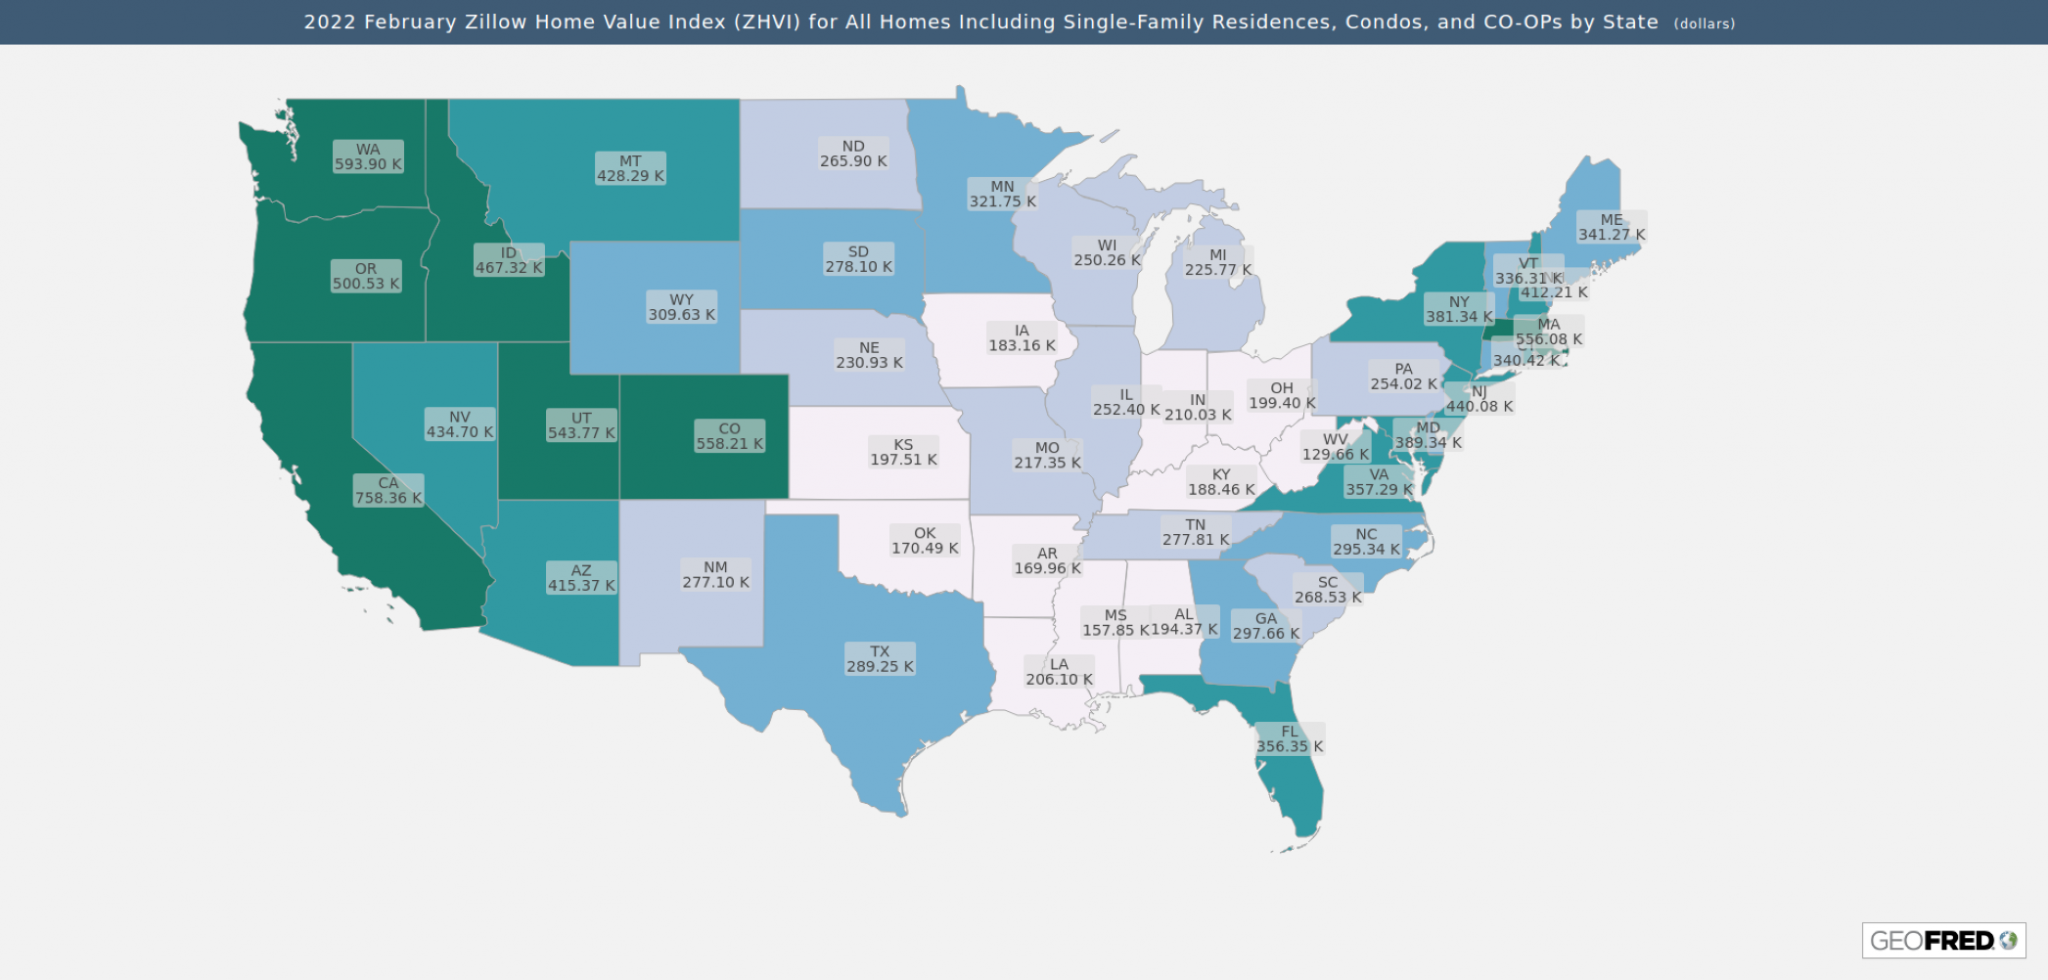
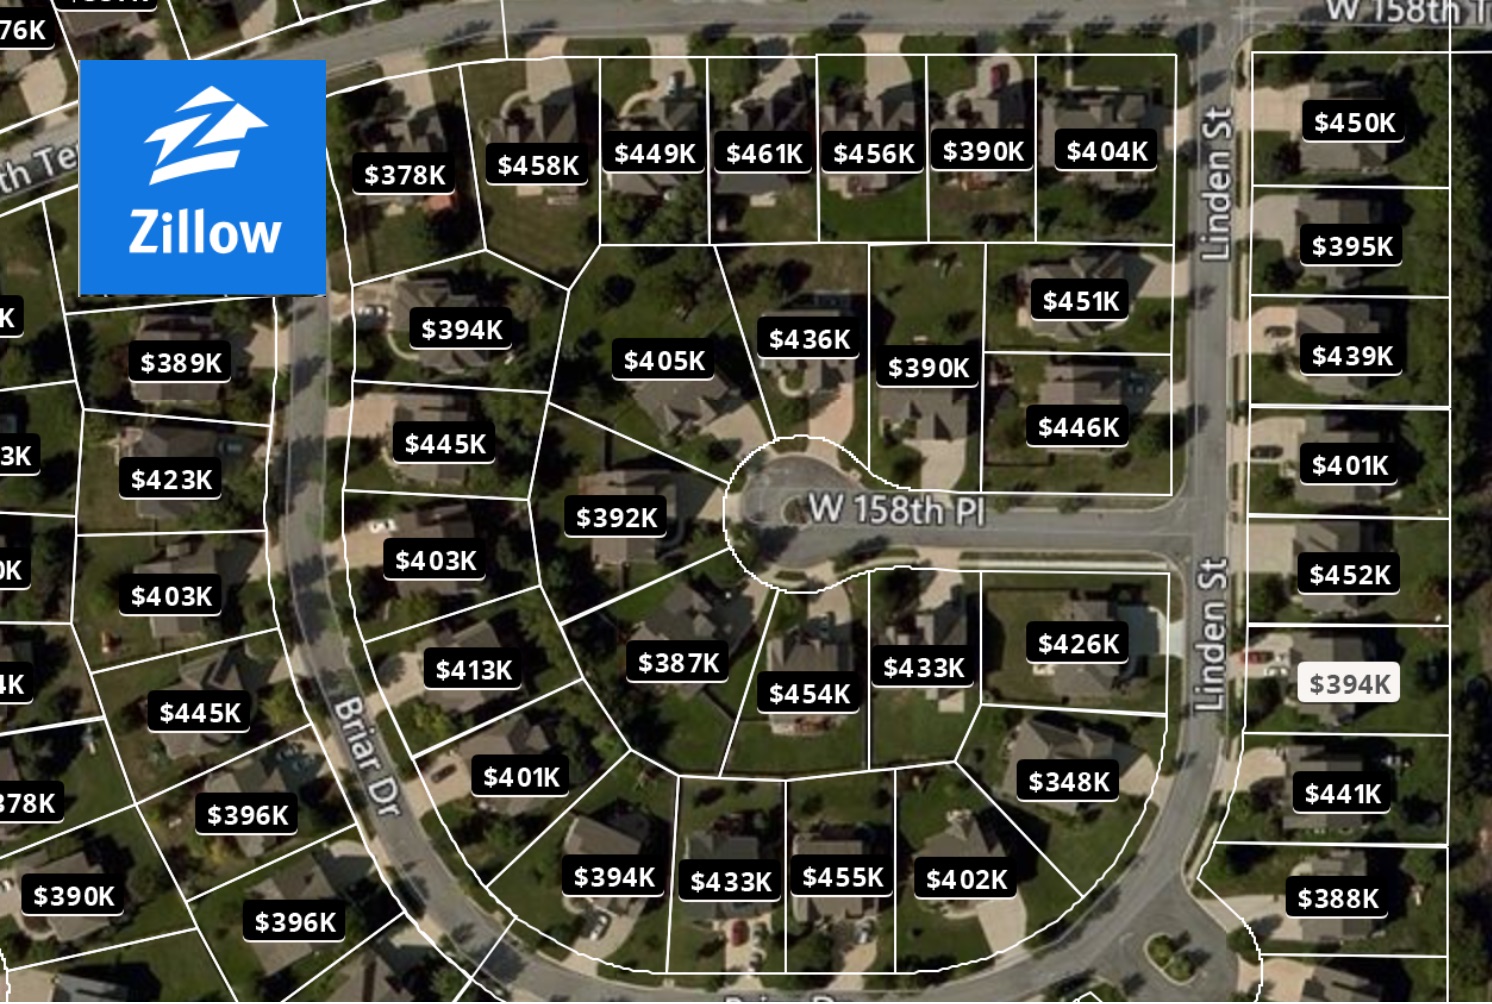
Zillow property values map – Zillow’s property values map offers a compelling, albeit imperfect, glimpse into the US real estate market. This readily accessible tool uses a complex algorithm incorporating diverse data sources to generate estimated property values, visualized geographically for easy interpretation. However, understanding its strengths and limitations is crucial for accurate analysis.
The map’s underlying methodology blends public records, Zillow’s own data, and user-submitted information to create a dynamic picture of home values. This process, while innovative, is subject to inherent biases and inaccuracies. Factors like location, property size, features, and recent sales significantly influence the displayed values, highlighting the need for careful consideration when interpreting the results. This article will explore the map’s functionalities, data sources, limitations, and best practices for utilization.
Understanding Zillow’s Property Value Map: Zillow Property Values Map
Zillow’s property value map is a widely used tool for visualizing home prices across different areas. However, understanding its methodology, limitations, and effective usage is crucial for accurate interpretation. This section delves into the intricacies of Zillow’s data, comparing it to other valuation services and highlighting potential pitfalls.
Zillow’s Property Valuation Methodology
Zillow employs a proprietary algorithm called the Zestimate to estimate property values. This algorithm incorporates a vast amount of data, including property characteristics (size, bedrooms, bathrooms), location, recent sales data, and local market trends. The Zestimate is a statistical model that continuously learns and adjusts based on new data inputs. It’s important to note that the Zestimate is not an appraisal and should not be used as a substitute for a professional valuation.
Data Sources for Zillow’s Estimates
Zillow leverages multiple sources to fuel its Zestimate calculations. These include public records (tax assessments, deed transfers), multiple listing service (MLS) data, and user-submitted information. The combination of these data points allows Zillow to build a comprehensive picture of property values in a given area. However, data accuracy and completeness can vary across different regions and property types.
Comparison with Other Valuation Services
Several other real estate platforms and services offer property value estimates. While the methodologies vary, most incorporate similar data points. However, the weighting and processing of this data differ significantly, leading to variations in estimated values. Direct comparisons between Zillow and other services, such as Redfin or Realtor.com, often reveal discrepancies.
Feature and Limitation Comparison Table
The following table compares the key features and limitations of Zillow’s property value map with other prominent sources:
| Feature/Limitation | Zillow | Redfin | Realtor.com |
|---|---|---|---|
| Data Sources | Public records, MLS, user data | MLS, public records | MLS, public records |
| Geographic Coverage | Nationwide | Nationwide | Nationwide |
| Accuracy | Varies by location and property type | Varies by location and property type | Varies by location and property type |
| User Interface | Intuitive map interface | User-friendly map and details | Comprehensive search and map features |
Interpreting Property Value Data on the Map
While Zillow’s map provides a visual representation of property values, understanding the factors that influence these values and the map’s limitations is crucial for proper interpretation. This section will explore these aspects, emphasizing the importance of contextual information.
Find out about how fate makes no mistakes mangabuddy can deliver the best answers for your issues.
Factors Influencing Property Values
Several factors contribute to the property values displayed on Zillow’s map. Location is paramount, with properties in desirable neighborhoods commanding higher prices. Property size, number of bedrooms and bathrooms, and features (e.g., pool, updated kitchen) also significantly impact value. The condition of the property and the overall state of the local market are additional key factors.
Representation of Different Property Types
Zillow’s map generally represents different property types (single-family homes, condos, townhouses) using similar visual cues, primarily color-coding based on estimated value. However, the underlying data and algorithms might be adjusted to account for the unique characteristics of each property type. Direct comparisons between different property types should therefore be approached with caution.
Limitations of Zillow’s Map for Accurate Predictions
It is crucial to recognize that Zillow’s map provides estimates, not precise valuations. The Zestimate is susceptible to errors due to data limitations, algorithm imperfections, and the inherent complexities of the real estate market. Using the map alone for making critical financial decisions, such as buying or selling a property, is strongly discouraged.
Contextual Information and Map Interpretation
Contextual information, such as recent sales data for comparable properties in the same neighborhood, can significantly enhance the interpretation of Zillow’s map. Analyzing local market trends, including supply and demand, can help contextualize the estimated values. For example, a rapidly appreciating neighborhood might show higher values on the map than a stagnant one, even if individual property characteristics are similar.
Utilizing the Map for Real Estate Research
Zillow’s property value map can be a valuable tool for real estate research, particularly for identifying potential investment opportunities and tracking market trends. This section Artikels a workflow for leveraging the map effectively.
Workflow for Real Estate Investment Analysis
A systematic approach is vital when using Zillow’s map for investment analysis. Begin by defining your investment criteria (e.g., budget, desired property type, location preferences). Then, use the map to identify areas meeting your criteria. Next, delve into individual property details on Zillow, comparing Zestimates with recent sales data and considering property characteristics. Finally, conduct thorough due diligence before making any investment decisions.
Identifying Investment Opportunities and Market Growth
The map can help pinpoint areas experiencing rapid value appreciation, indicating potential investment opportunities. By comparing values across different neighborhoods over time, investors can identify areas with strong growth trajectories. However, it’s crucial to analyze underlying factors driving this growth (e.g., infrastructure improvements, economic development) to ensure the trend is sustainable.
Comparing Property Values Across Neighborhoods
The map’s visual representation facilitates easy comparison of property values across different neighborhoods. By observing color variations and value ranges, potential investors can quickly identify areas with higher or lower average property values. This initial screening can help narrow down the search and focus on specific areas that align with investment goals.
Tracking Property Value Changes Over Time
Zillow allows users to track property value changes over time by accessing historical Zestimate data. This feature is valuable for monitoring investment performance and understanding long-term market trends. By comparing historical and current Zestimates, investors can gauge the rate of appreciation or depreciation in specific areas or for individual properties.
Visual Representation and Data Presentation
Zillow’s map utilizes color-coding and other visual cues to effectively convey property value information. Understanding how these visual elements are used is crucial for accurate interpretation and avoiding potential misinterpretations. This section will explore these aspects in detail.
Visual Elements and Information Conveyance
Zillow primarily uses color gradients to represent property value ranges on its map. Generally, warmer colors (e.g., red, orange) indicate higher values, while cooler colors (e.g., blue, green) represent lower values. The specific color scheme and value ranges might vary depending on the area being viewed. The map also incorporates interactive features, allowing users to zoom in and out, select specific properties, and view detailed information.
Color-Coding and Visual Cues Table
The following table illustrates how color-coding and other visual cues are typically used on Zillow’s property value map:
| Color Range | Approximate Value Range (Example) | Visual Cue |
|---|---|---|
| Dark Red | >$1,000,000 | High Value |
| Orange | $750,000 – $1,000,000 | Above Average Value |
| Yellow | $500,000 – $750,000 | Average Value |
| Green | $250,000 – $500,000 | Below Average Value |
| Blue | <$250,000 | Low Value |
Hypothetical Zillow Map Description
Imagine a Zillow map of a suburban area. The central, established neighborhood is depicted in shades of orange and red, indicating high property values. As you move towards the outskirts, the colors gradually shift to yellow and green, representing lower values. A newly developed area on the edge of the map might be shown in lighter shades of green or even blue, reflecting relatively lower property values due to newer construction and less established infrastructure.
Areas with recent sales are potentially highlighted with different markers or icons.
Potential for Misinterpretations
The visual presentation of data on Zillow’s map can lead to misinterpretations if not carefully considered. The color gradients might not always be linearly scaled, leading to skewed perceptions of value differences. The map also doesn’t account for individual property characteristics, which can significantly impact value. Over-reliance on visual cues without considering contextual information can result in inaccurate conclusions.
Accuracy and Limitations of Zillow’s Estimates

While Zillow’s Zestimate provides a valuable overview of property values, it’s crucial to understand its limitations and potential inaccuracies. This section addresses these aspects, offering recommendations for cautious interpretation.
Sources of Error and Inaccuracy
Several factors can contribute to errors in Zillow’s estimates. Data inaccuracies (incomplete or outdated information) can significantly affect the algorithm’s calculations. The algorithm itself is a statistical model, and its estimations are inherently probabilistic, not deterministic. Unique property features or recent market shifts not yet reflected in the data can also lead to discrepancies.
Discrepancies Between Zestimates and Actual Market Values, Zillow property values map
Discrepancies between Zestimates and actual market values are common. Factors like recent renovations, unique property features (e.g., a custom-built pool), or unusual market conditions (e.g., a seller’s market with high demand) can cause significant deviations. A property’s condition, which is often difficult to assess accurately through publicly available data, can also lead to discrepancies.
Accuracy Compared to Other Valuation Tools
The accuracy of Zillow’s estimates varies compared to other publicly available tools. No single tool provides perfectly accurate valuations. However, comparing Zestimates with estimates from other services (Redfin, Realtor.com) can offer a broader perspective and highlight potential inconsistencies. Using multiple sources helps to cross-reference and potentially identify outliers.
Recommendations for Cautious Interpretation
Users should treat Zillow’s property value data as an estimate, not a definitive valuation. Always cross-reference with other sources, consider recent comparable sales data, and account for individual property characteristics. Never make critical financial decisions solely based on Zestimates. For accurate valuations, consult a qualified real estate appraiser.
Zillow’s property value map serves as a powerful, albeit imperfect, tool for real estate research. While offering a convenient visual representation of property values across various locations, users must approach the data with critical awareness of its inherent limitations. By understanding the methodology behind the estimations and considering contextual factors, individuals can leverage the map effectively for preliminary market analysis, identifying potential investment opportunities, and tracking property value trends over time.
However, independent verification and professional appraisal remain essential for making informed real estate decisions.

